Generate timetable using matplotlib
23 May 2015
Language Select:
Introduction
The other day, I made timetables using matplotlib for a little issue. It will be use for some conferences or symposiums.
What does it do?
- Reading room name, beginning time (hour, minute), duration, and event names.
- Plot events with different colors with the room name.
- Plot event name and beginning time.
Data format
You can make input data files like flowing one. It contains room name, beginning time (hour), beginning time (minute), duration, and event name. Make the room name as consecutive number. In this input data,1 is ‘Room A’, 2 is ‘Room B’.
1	9	0	90	A1
2	9	20	90	B1
3	9	40	90	C1
4	10	0	90	D1
5	10	20	90	E1
1	10	45	90	A2
2	11	5	90	B2
3	11	25	90	C2
4	11	45	90	D2
5	12	5	90	E2
1	12	30	50	A3
2	12	50	50	B3
3	13	10	50	C3
4	13	30	50	D3
5	13	50	50	E3
1	13	30	90	A4
2	14	0	60	B4
Save it as data1.txt.
Processing program
If you want to increase the number of room, you can add data to rooms and colors list. If you want to increase the number of day, you can add data to input_files and day_labels list.
1 #!usr/bin/env python
2 #coding: utf-8
3 import matplotlib.pyplot as plt
4 rooms=['Room A','Room B', 'Room C', 'Room D', 'Room E']
5 colors=['pink', 'lightgreen', 'lightblue', 'wheat', 'salmon']
6
7 input_files=['data1.txt']
8 day_labels=['Day 1']
9
10
11 for input_file, day_label in zip(input_files, day_labels):
12 fig=plt.figure(figsize=(10,5.89))
13 for line in open(input_file, 'r'):
14 data=line.split()
15 event=data[-1]
16 data=map(float, data[:-1])
17 room=data[0]-0.48
18 start=data[1]+data[2]/60
19 end=start+data[3]/60
20 # plot event
21 plt.fill_between([room, room+0.96], [start, start], [end,end], color=colors[int(data[0]-1)], edgecolor='k', linewidth=0.5)
22 # plot beginning time
23 plt.text(room+0.02, start+0.05 ,'{0}:{1:0>2}'.format(int(data[1]),int(data[2])), va='top', fontsize=7)
24 # plot event name
25 plt.text(room+0.48, (start+end)*0.5, event, ha='center', va='center', fontsize=11)
26
27 # Set Axis
28 ax=fig.add_subplot(111)
29 ax.yaxis.grid()
30 ax.set_xlim(0.5,len(rooms)+0.5)
31 ax.set_ylim(15.1, 8.9)
32 ax.set_xticks(range(1,len(rooms)+1))
33 ax.set_xticklabels(rooms)
34 ax.set_ylabel('Time')
35
36 # Set Second Axis
37 ax2=ax.twiny().twinx()
38 ax2.set_xlim(ax.get_xlim())
39 ax2.set_ylim(ax.get_ylim())
40 ax2.set_xticks(ax.get_xticks())
41 ax2.set_xticklabels(rooms)
42 ax2.set_ylabel('Time')
43
44
45 plt.title(day_label,y=1.07)
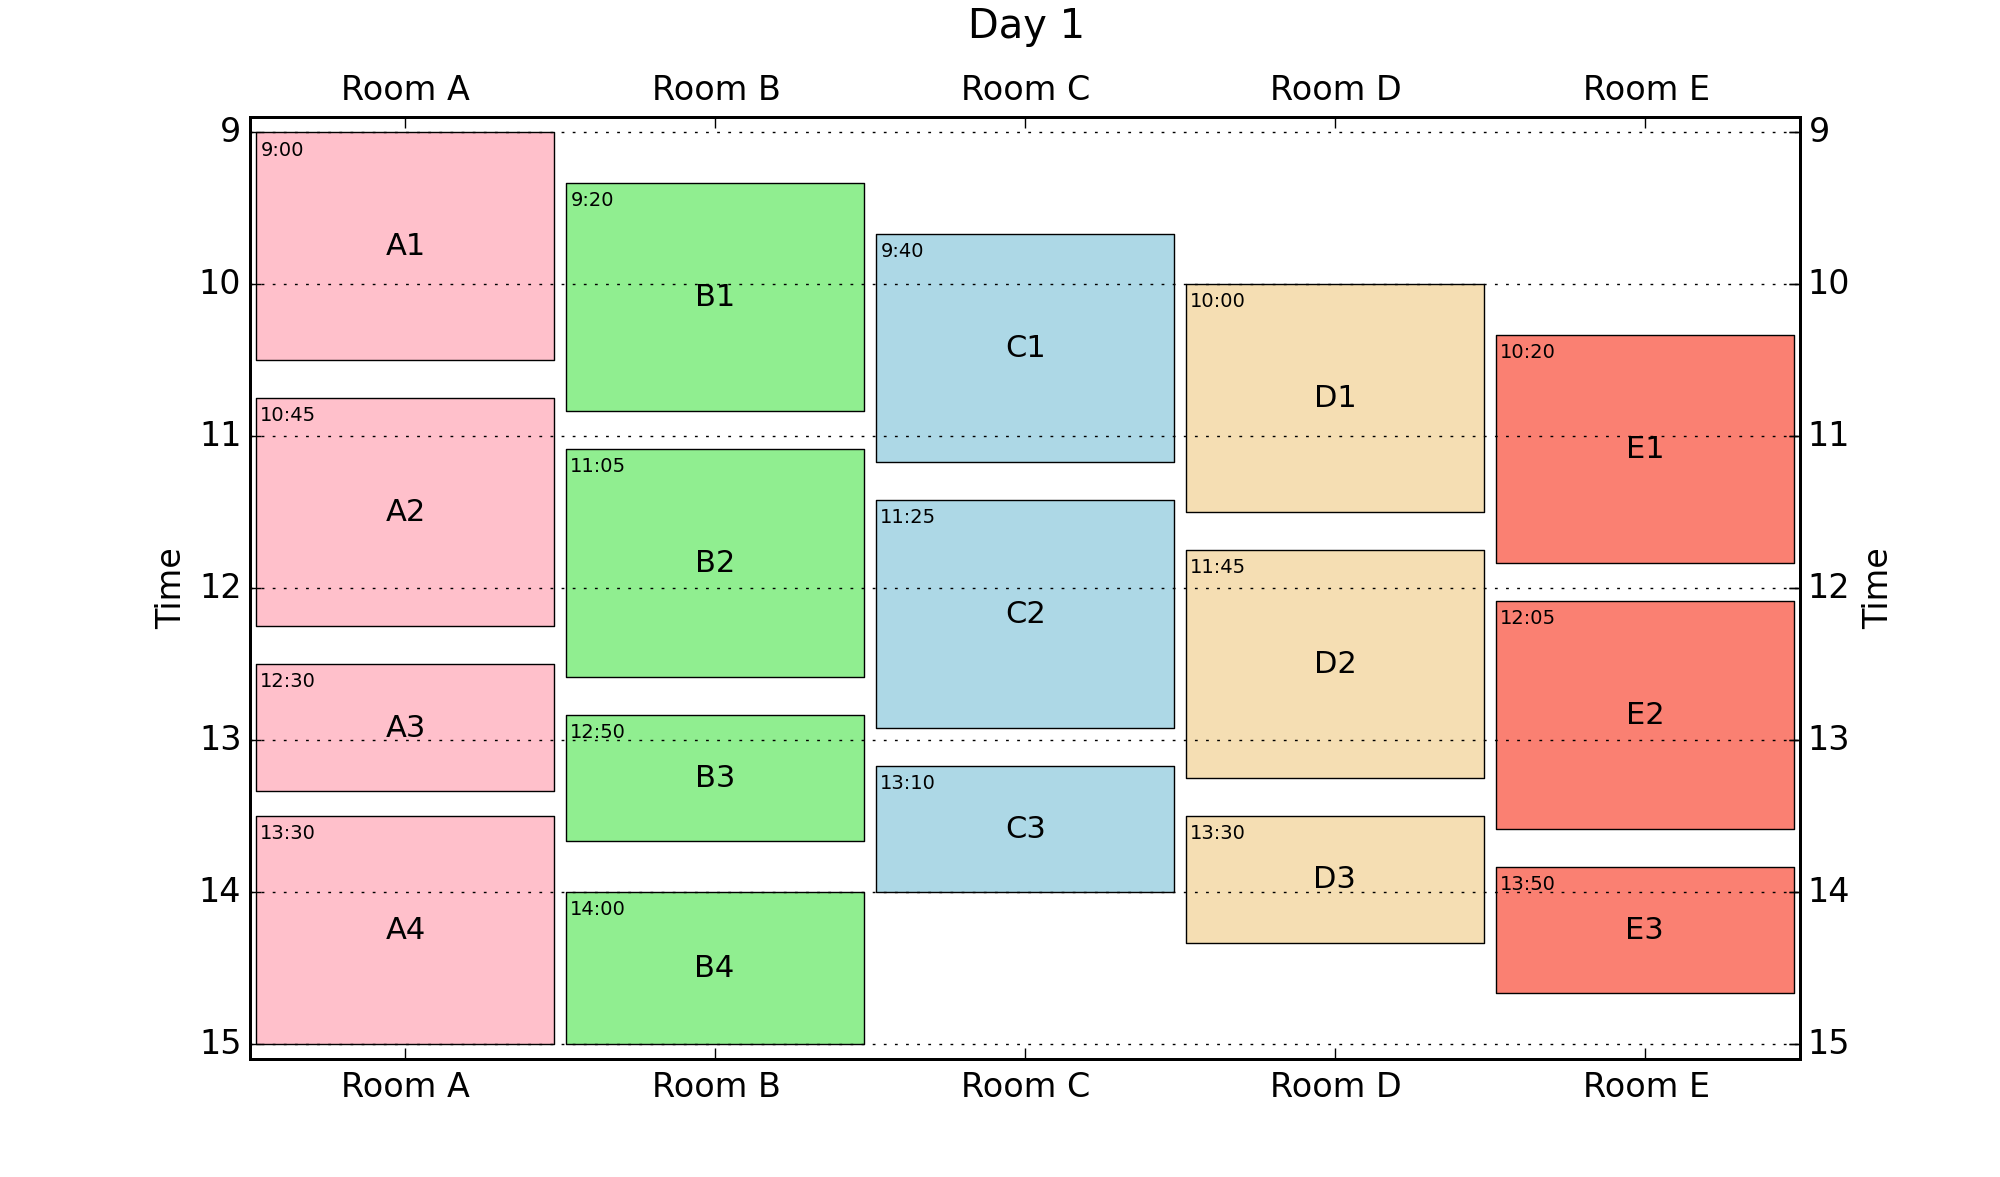
46 plt.savefig('{0}.png'.format(day_label), dpi=200)Output image
When you execute the programs, you can get the images below.
blog comments powered by Disqus